FH® Dashboards
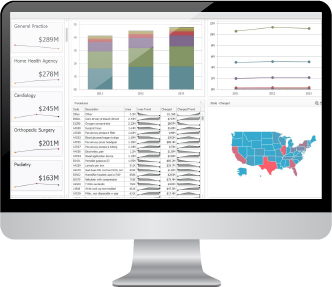
Don’t have your own staff of data analysts? Interactive FH Dashboards analytic and visualization tools make it easy to view, analyze and drill down into your FAIR Health dataset to illuminate your findings. This one-stop solution helps you conduct your analyses simply and effectively and also serves as a presentation tool to inform decision making, strategic planning and management reports.

Stay Informed.
Sign up for updates on new FAIR Health studies, infographics, grant-funded
projects and more.
Streamline Your Analyses; Illuminate the Results
FAIR Health’s customized datasets provide you with data to conduct your own analyses. Or, you can select FH Dashboards, easy-to-use visualization and analytic tools that help you streamline your analyses and drill down through the data to reveal new insights, isolate essential elements and highlight your findings. Topics for dashboards we have created to date include specialty Rx, durable medical equipment (DME), dental services, emergency room treatment, evaluation and management (E&M) and place of service data.
This interactive presentation tool offers you:

Learn more and speak to a FAIR Health representative today.
- Point-and-click desktop access to reveal multiple layers of data. With the click of a mouse, view and compare cost and utilization data, including provider’s specialty; sort the data to view it by geographic location at the state, region or geozip level; striate results by patient age and gender; and view trending over time, procedure code, diagnosis code and/or associated category.
-
Presentation options.
- Your customized dashboard can present FAIR Health data alone, or compare them to your own data or an external source, such as Medicare fees.
- You can apply any combination of a variety of filters to isolate data elements to refine your analyses.